Reading Spine MRI

Neuroradiology series · Part 3 of 4

Nerve Root & Foramen

Two zones, two grading systems, two sequences — and the muscle finding that tells you which level is live.

Companion to Parts 1 and 2.

1Two zones, and the root that belongs to each

Part 2 graded the middle of the canal, where the whole cauda equina sits. This part is about the two places a single named root gets caught — and they are different problems, on different sequences, with different grading systems.

Which root, which zone, which system Two different roots are in trouble at the same disc level, and they are graded on different sequences. Getting this wrong renames the patient’s problem. Where you are looking Which root is there How to grade it Lateral recess also called the subarticular zone — inside the canal, before the foramen The TRAVERSING root At L4–5 that is the L5 root, on its way down to exit at L5–S1. Pfirrmann graded on axial T2 0 contact · 1 · 2 · 3 The foramen the doorway itself, out to the side The EXITING root At L4–5 that is the L4 root, leaving the canal at this level. Lee graded on sagittal T1 0 · 1 · 2 · 3 The error that actually happens A disc at L4–5 usually catches the L5 root in the recess. The same level failing at the foramen catches L4 instead. Same disc, different leg, different operation. If the grade and the symptoms name different roots, say so rather than picking one.
Two different papers are both called “the Lee grading system”, and both come from the same unit in Seoul. Lee S et al., AJR 2010, grades the foramen — that is the one on this page. Lee GY et al., Skeletal Radiol 2011, grades the central canal — that is the one compared against Schizas in Part 2. If someone says “Lee grade 2” without saying which, ask.

2Pfirrmann — the root in the lateral recess

Four grades, on axial T2, describing what a disc is doing to one root. The whole system is a sequence of four verbs: nothing, touching, pushing, squashing.
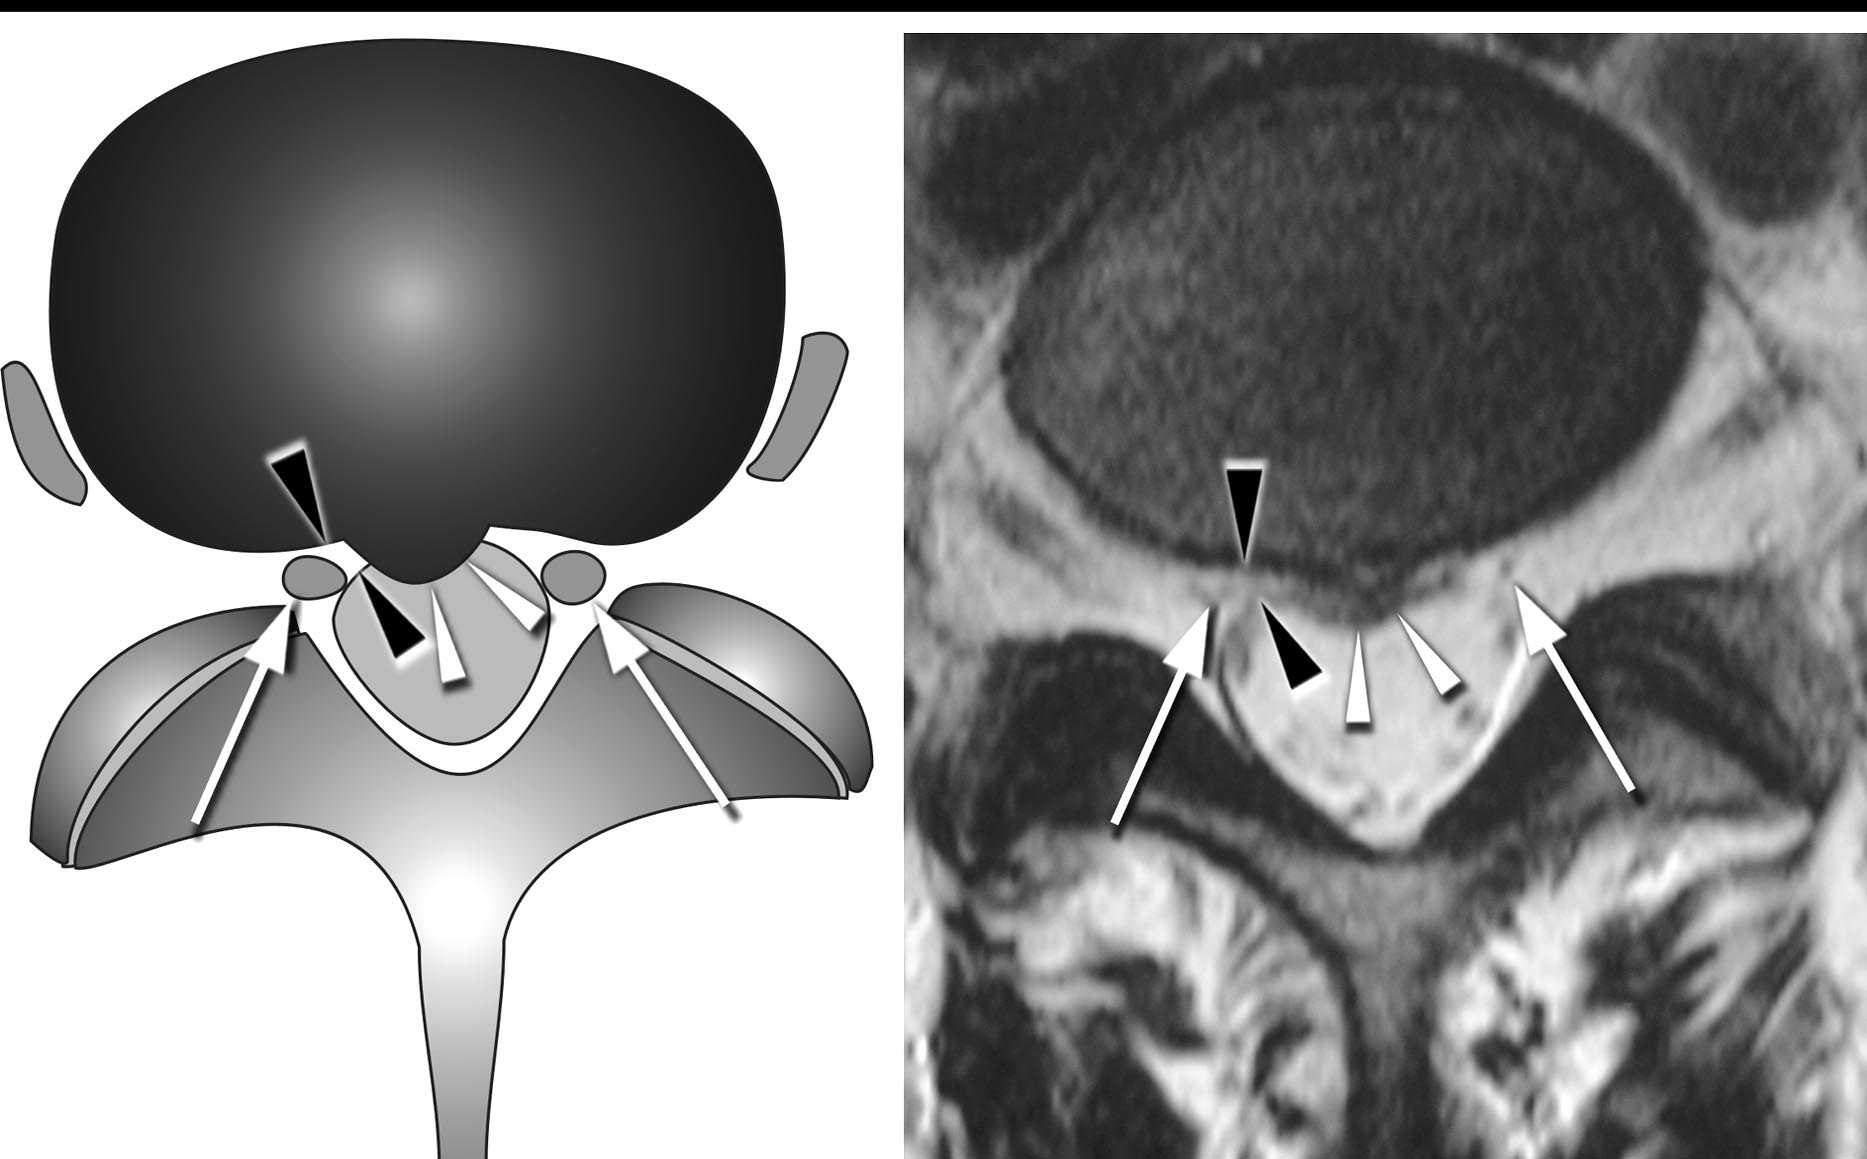
Why this one earns its place. Most grading systems only ever show that readers agree with each other. Pfirrmann went further: 94 of the roots were then operated on, and the grade read off the MRI was compared with what the surgeon recorded. The correlation was r = 0.86. The grade predicts what is actually found at the time of surgery.
Diagram and axial T2 showing a normal nerve root
Pfirrmann et al., Radiology 2004, Figure 1 permission pending

Grade 0 — normal

Axial T2 at the disc level

No contact between disc material and the root, and the epidural fat layer between them is still there. That fat layer is the thing to look for — it is the first thing to go.
What it means: this root is not the explanation. Keep looking.
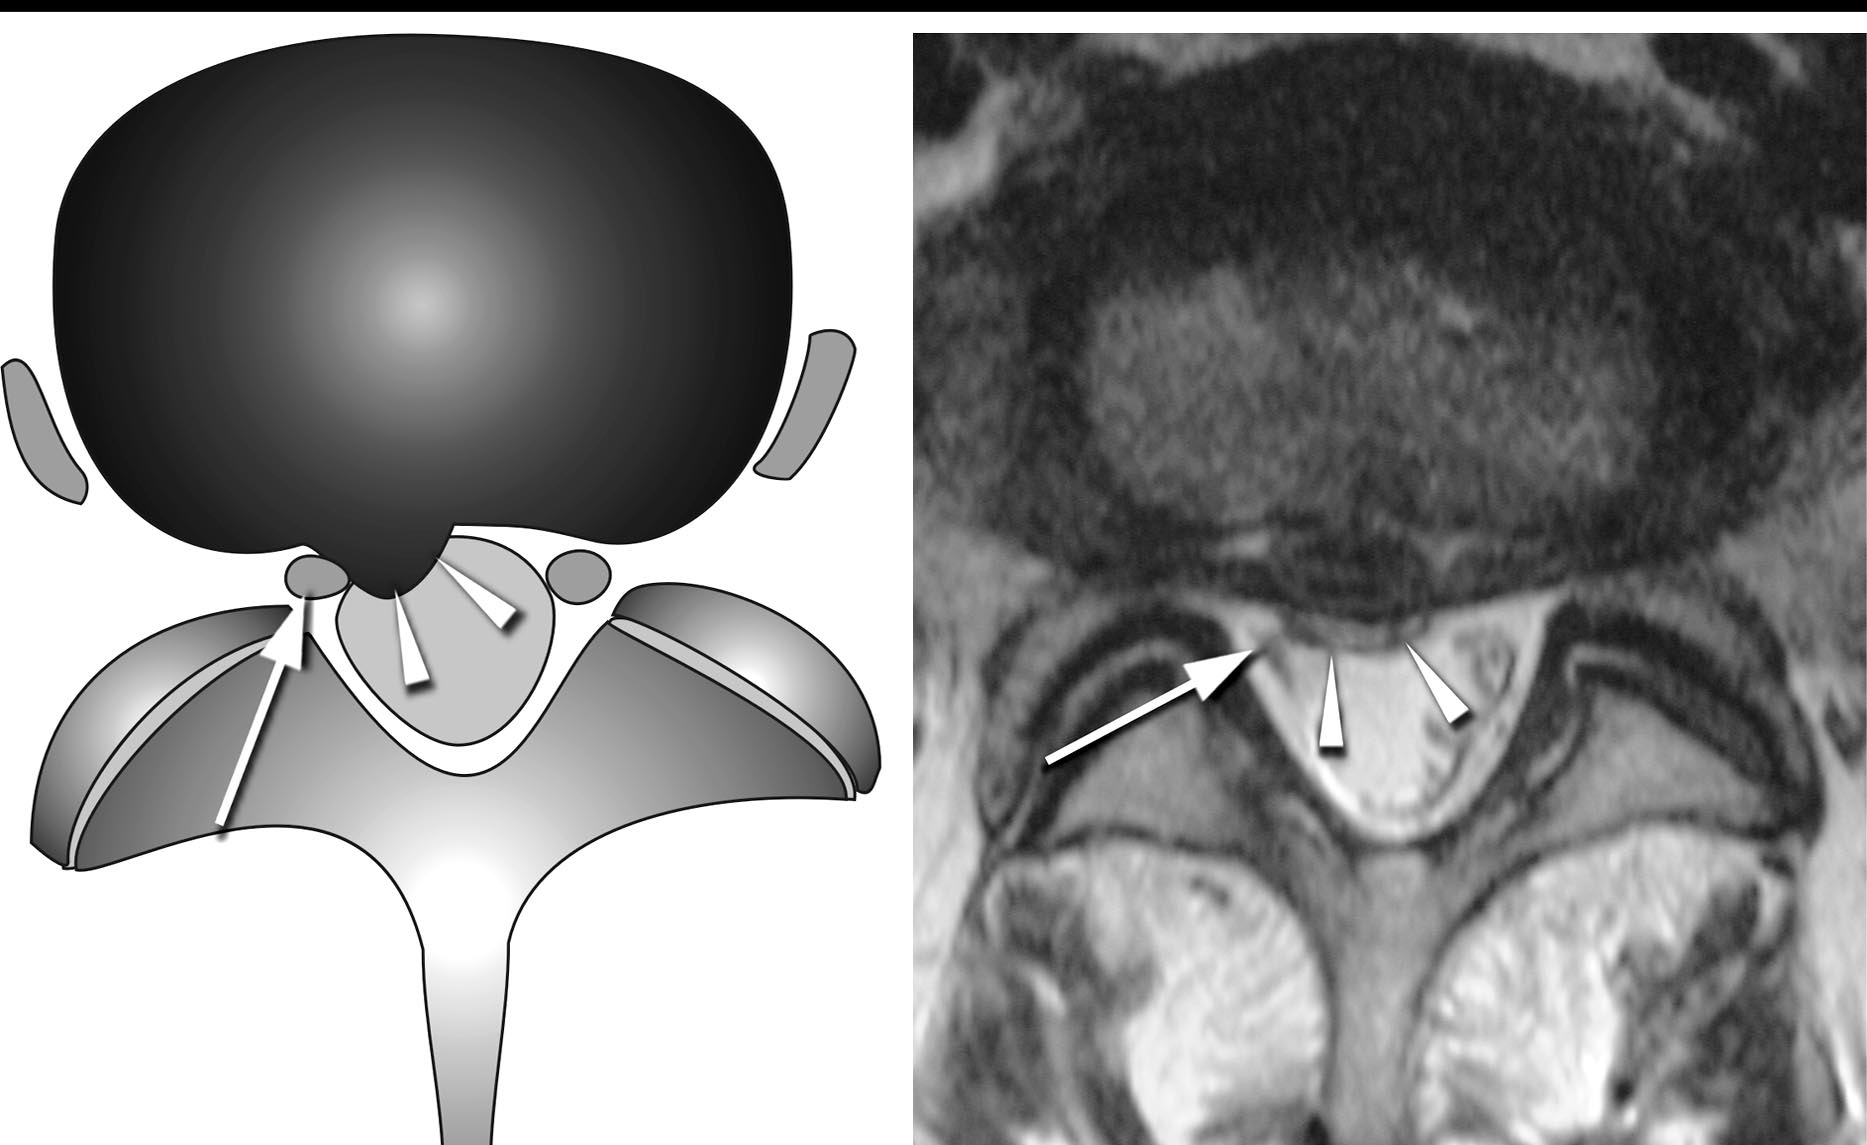
Diagram and axial T2 showing disc material contacting the nerve root
Pfirrmann et al., Radiology 2004, Figure 2 permission pending

Grade 1 — contact

Axial T2 at the disc level

Disc material is touching the root and the fat layer between them has gone. But the root is still in its normal position — it has not been pushed anywhere.
What it means: common, and on its own weak evidence. Contact without displacement is found in plenty of people who feel nothing.
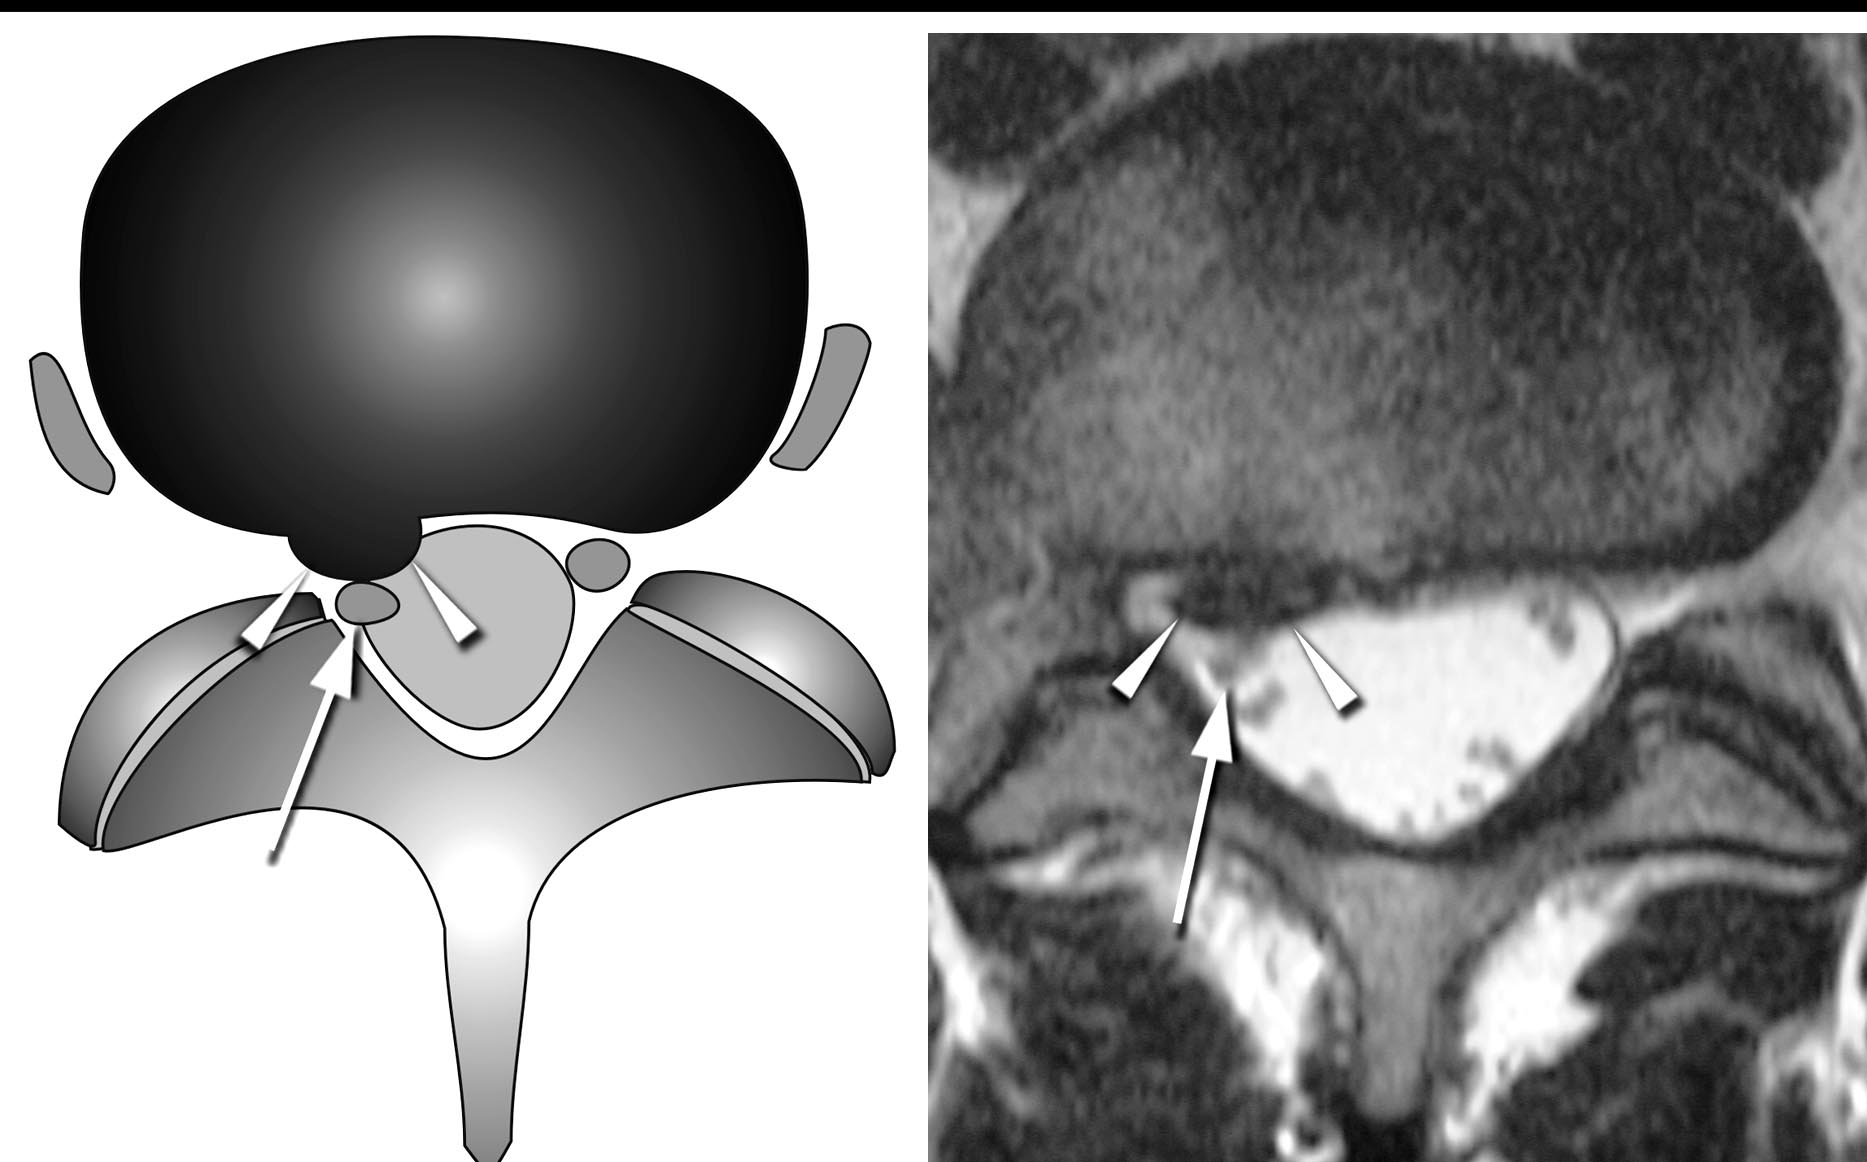
Diagram and axial T2 showing the nerve root deviated dorsally
Pfirrmann et al., Radiology 2004, Figure 3 permission pending

Grade 2 — deviation

Axial T2 at the disc level

The root has been pushed backwards out of its normal position by disc material. It is displaced, but it still has its own shape.
What it means: now the disc is doing something mechanical to a named root. Worth correlating carefully against which leg and which dermatome.
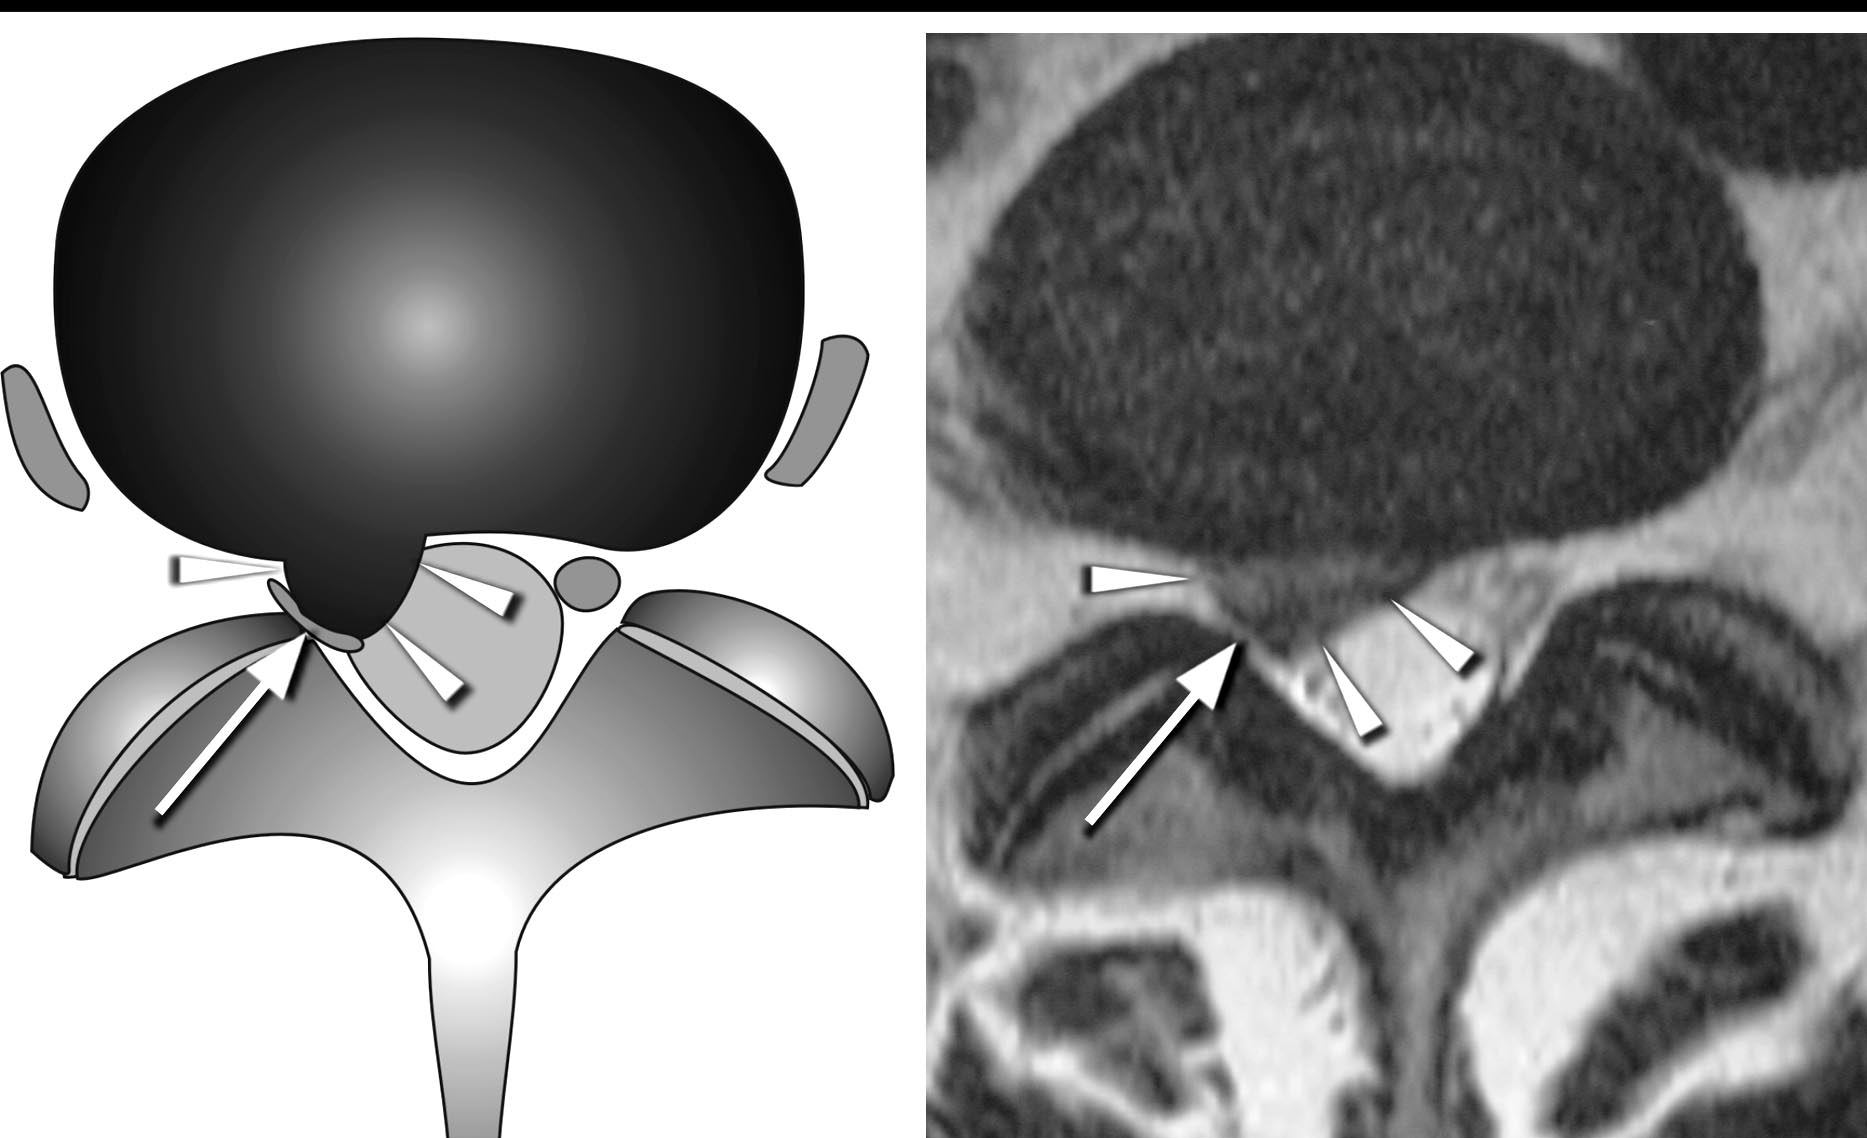
Diagram and axial T2 showing the nerve root compressed and flattened
Pfirrmann et al., Radiology 2004, Figure 4 permission pending

Grade 3 — compression

Axial T2 at the disc level

The root is trapped between disc material and the wall of the canal. It may look flattened, or you may not be able to tell root from disc at all — that inability to separate them is the finding.

What it means: the most severe grade, and the one that most often matches a convincing radicular story. Say which root and which side.

3Lee — the root in the foramen

Four grades again, but a completely different question. In the foramen the root normally sits in a cuff of fat, and the grade counts from how many directions that fat has been squeezed out.
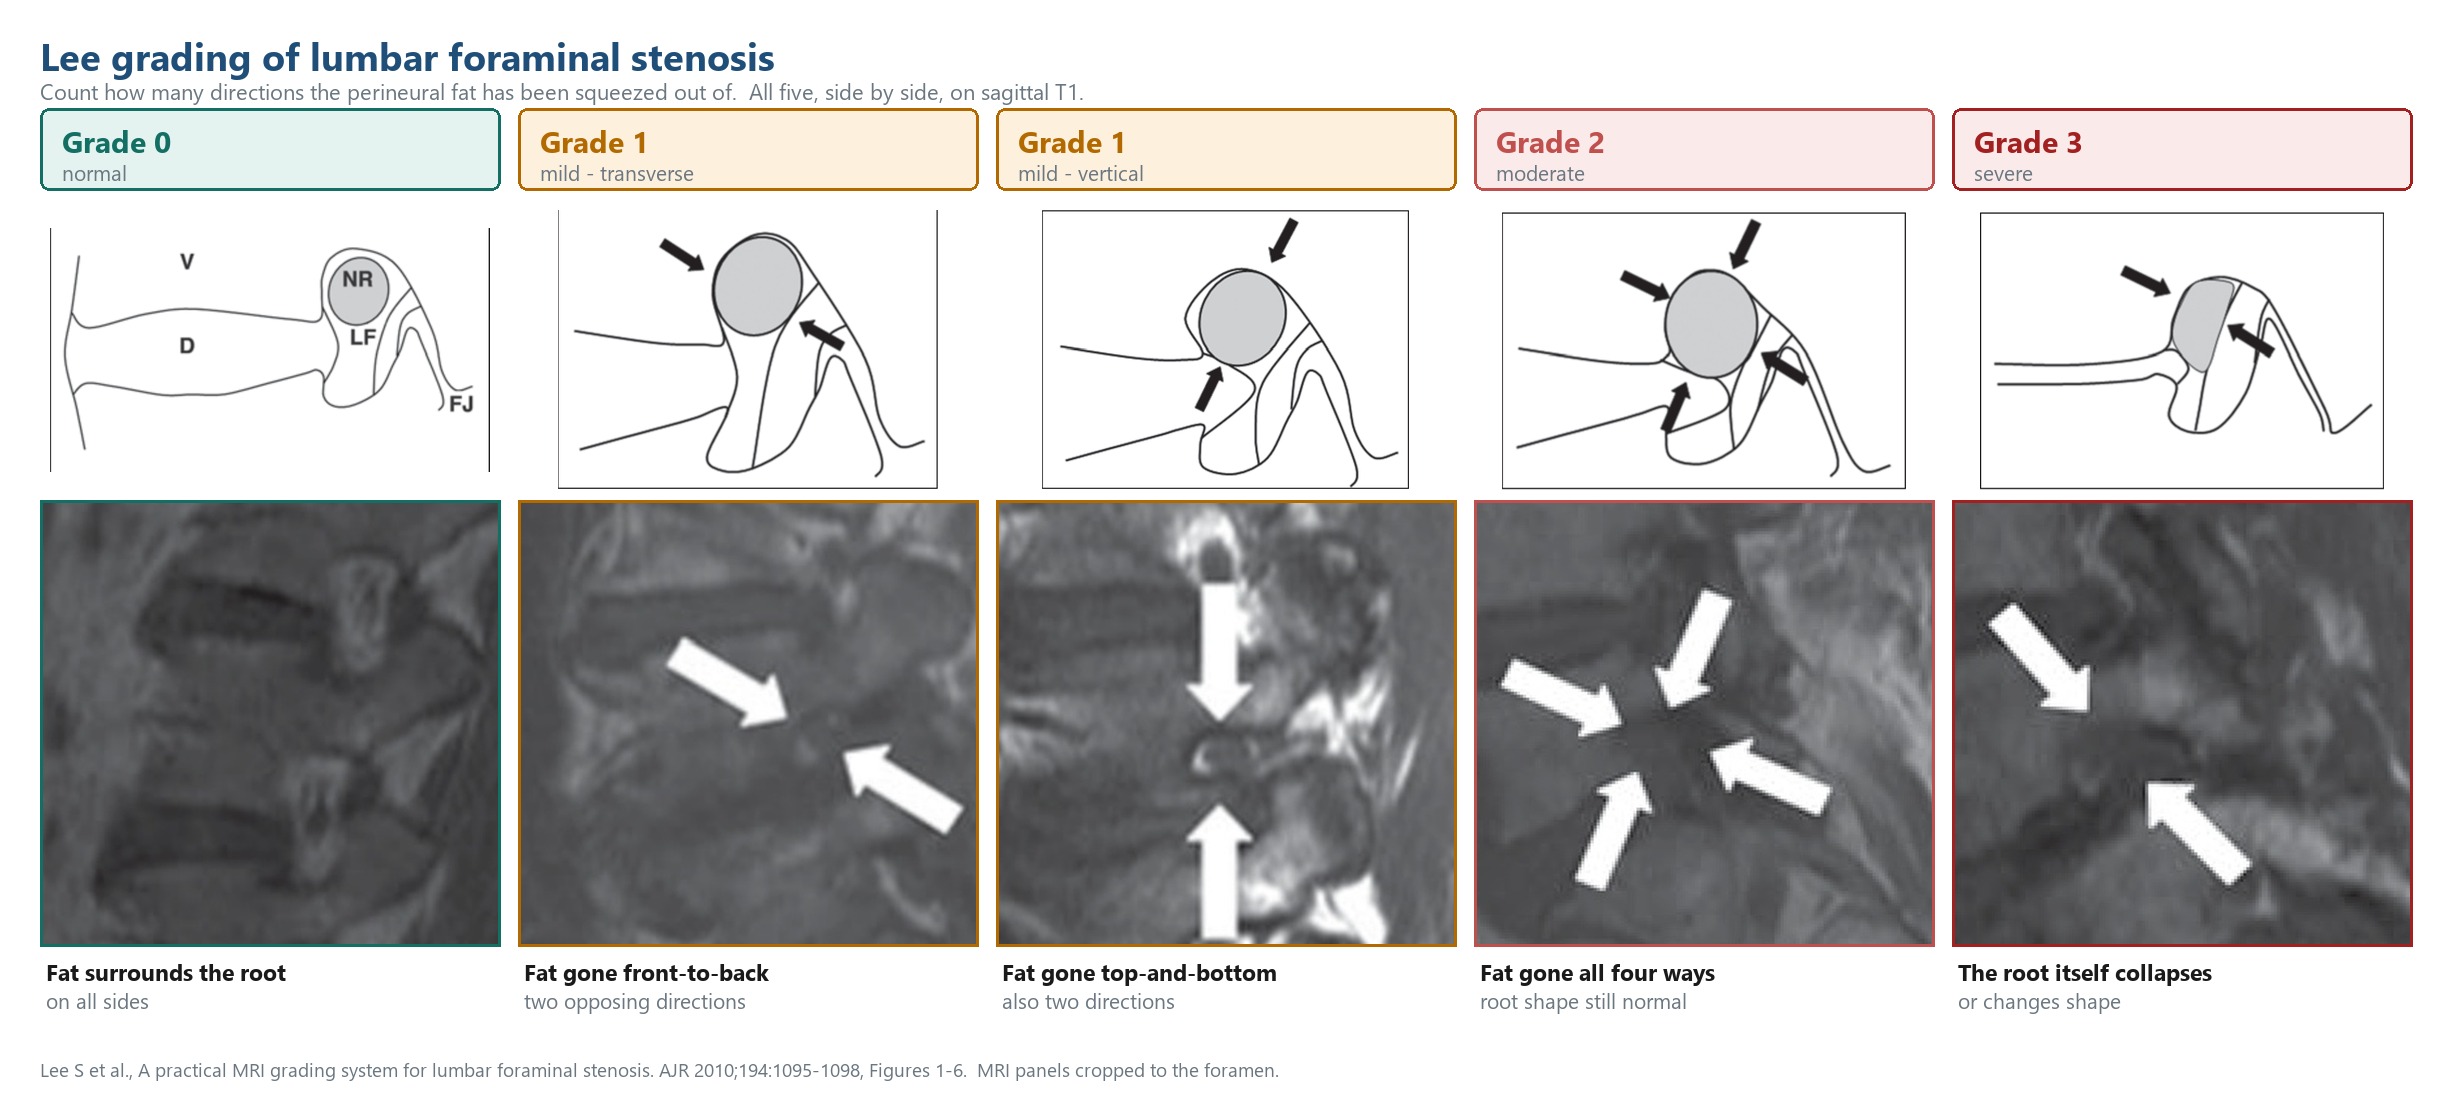
Change sequence here, or you will miss it. Lee is graded on sagittal T1, not T2. Perineural fat is bright on T1, so the fat cuff — and its disappearance — is obvious there and much harder to judge on T2. The original paper used T2 only as a cross-check, to avoid calling a perineural cyst or a swollen root as stenosis.
All five Lee grades side by side: schematic above, zoomed MRI below
Click this one first, and read it left to right. The whole system is one question asked five times: how many directions has the fat gone from? Both grade 1 variants are shown because they look completely different from each other and are the same grade — that is the part people find confusing.
The MRI panels are cropped to the foramen so the root and its fat cuff are actually legible; click for full size.
Lee S et al., AJR 2010;194:1095–8, Figures 1–6 permission pending

The five grades, and the case shown for each above:

GradeWhat you are looking atThe case in the figure above
0 · normal Fat surrounds the root on all sides. 62-year-old woman with low back pain; a normal root, fat cuff intact.
1 · mild, transverse Fat gone in two opposing directions — here front-to-back. 69-year-old woman, right leg pain; narrowed transverse width of the foramen.
1 · mild, vertical Also two directions, but top-and-bottom instead. Same grade. 63-year-old man, left leg weakness; reduced foraminal height.
2 · moderate Fat gone in all four directions. Root shape still normal. 65-year-old woman, right leg pain; narrowed disc space, thickened ligamentum flavum.
3 · severe The root itself collapses or changes shape. 82-year-old woman, right leg pain; collapse of the right L4–L5 root.

Schematics and cases from Lee S et al., AJR 2010;194:1095–8, Figures 1–6 permission pending. Every panel is clickable.

Both systems are reliable, and Lee is the more reproducible of the two. Pfirrmann reported κ 0.62–0.67 between observers and 0.72–0.77 within one observer — substantial. Lee reported κ 0.905–1.0 between observers and 0.800–1.0 within — near perfect. Counting how many directions the fat has gone is an easier judgement than deciding whether a root has been deviated.

4The sequence trap

Everything in Parts 1 and 2 was graded on T2. This part is where that habit breaks.

SystemSequenceBecause
Schizas · central canalAxial T2 You are looking for cerebrospinal fluid, which is bright on T2.
Pfirrmann · lateral recessAxial T2 You are looking at the root against fluid and disc, in cross-section.
Lee · foramenSagittal T1 You are looking for fat, which is bright on T1. On T2 the fat cuff is far less conspicuous and the grade becomes guesswork.
Practical version. When you get to step 4 of the lumbar read, change sequence. If you grade foramina off the T2 stack because that is what was already on screen, you will under-call foraminal disease — which is already the most commonly missed lesion in the lumbar spine.

5Denervation oedema — the level localiser

Three levels look degenerate. The patient has one radiculopathy. Anatomy cannot tell you which level is live — but the muscle sometimes can.
Why muscle signal localises the level This is the one finding on the study that comes from the patient’s physiology rather than their anatomy — which is why it settles arguments. A root is compressed at one level, on one side Its dorsal ramus fails the medial branch supplies multifidus — and it supplies essentially ONE segment That slip denervates muscle fibres lose their nerve supply and take on water STIR lights up bright signal in multifidus at that level, on that side, and not its neighbours What it is worth It tells you which level is currently symptomatic when three levels look equally degenerate. Anatomy cannot do that. What it is not Not fatty atrophy. Fat is bright on T1 and stays bright when fat is suppressed; oedema is bright on STIR and dark on T1. Opposite findings. Read it side to side, never top to bottom Compare left multifidus against right multifidus at the same level. Both sides age together, so an asymmetry is the signal. Comparing one level against another tells you far less, because everybody’s lower lumbar muscle looks worse than their upper.
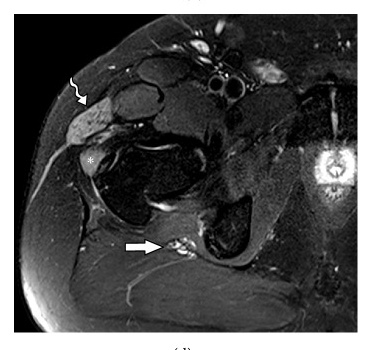
Axial T2 fat-saturated showing unilateral muscle oedema with both sides in frame
Acute denervation in a lumbosacral myotome, one side only.
Soldatelli et al., Biomed Res Int 2018;2018:9608947, Fig 4d CC BY

What denervation oedema looks like

Axial T2 fat-sat or STIR · both sides in the frame, always

Diffusely bright muscle on one side, normal muscle on the other. No mass, no fluid collection, no disruption of the muscle architecture — just signal, filling the whole belly of the affected muscles.

Read it side to side. The finding is not that the right side is bright — it is that the right is bright and the left is not. Both sides age at the same rate, so asymmetry is the entire signal. Comparing one level against another tells you far less.

An honest caveat about this image. These are gluteal and tensor fascia lata muscles, not multifidus — the same phenomenon in the same region, one myotome further out. I could not find an openly licensed image of acute paraspinal denervation specifically, having looked from several directions. What this teaches is the appearance; the muscle you would apply it to in the lumbar spine is multifidus, immediately beside the affected level.
Denervated muscle changes over time, and swaps which sequence shows it The same muscle is bright on opposite sequences depending on how long ago the nerve failed. Read one sequence alone and you will date it wrongly. Acute under 1 month T1 normal T2 / STIR BRIGHT With contrast enhances The muscle is oedematous. Nothing has been lost yet. Subacute 1 to 6 months T1 normal-ish T2 / STIR BRIGHT With contrast variable Still reversible territory. Fat has not replaced muscle yet. Chronic beyond 6 months T1 BRIGHT — fat T2 / STIR dark With contrast none Muscle has been replaced by fat. This does not come back. Why the scan can beat the nerve study to the answer Muscle signal change can be imaged at any point after the deficit appears. Electromyography normally has to wait two to three weeks before it shows anything. Inside that first fortnight the scan may be the only test that can localise the level.
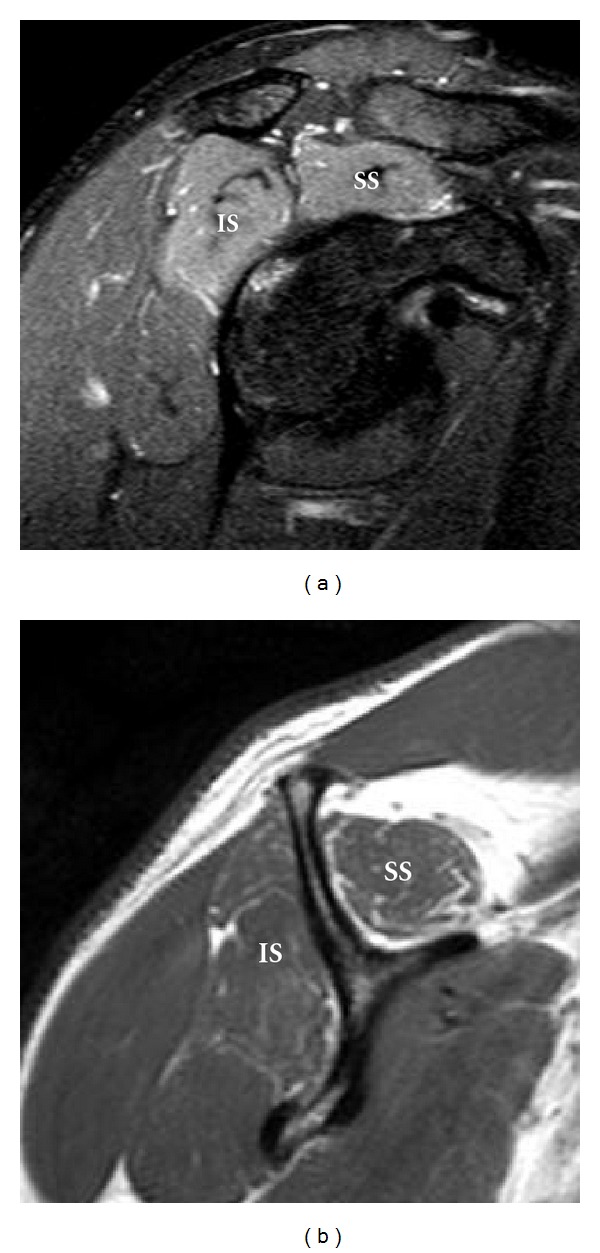
T2 fat-saturated and T1 images of the same denervated muscles
Chahal et al., Radiol Res Pract 2012;2012:230679, Fig 2 CC BY

Oedema and fatty atrophy are opposite findings

The same muscles · T2 fat-sat above, T1 below

This is the confusion worth heading off, because the two mean opposite things about time and they appear on opposite sequences:

Oedema
Bright on T2 / STIR, dark on T1. Something is happening now, and there is still muscle there to save.
Fatty atrophy
Bright on T1, suppressed on STIR. Something happened months ago and muscle has already been replaced.

This patient shows both — common, and the reason the two sequences have to be read together.

The trap: bright paraspinal muscle on a T1 image is not an acute finding. It is fat, and it is old news. Chronic multifidus fatty change is near-universal in degenerative spines and says nothing about which level is symptomatic today.

6What you can and cannot call

Call it and act on itDefer it, always
Which root is affected, and on which sideAny mass or enhancing lesion around a root
Pfirrmann grade in the recess · Lee grade in the foramenWhether a root is inflamed — that needs contrast and a radiologist
Whether the fat cuff is preserved or gonePlexus or extraforaminal disease
Whether the imaging matches the dermatomeWhether the finding is old or new, from one study alone
Asymmetric muscle signal, if you see itThe operative level — the surgeon’s call
The sentence to write. "Right L4–5 foraminal narrowing, Lee grade 3, with collapse of the exiting right L4 root. Recess is Pfirrmann 1 bilaterally. Symptoms are right anterior thigh — fits L4, fits the foramen." Naming the zone, the root and the side is what makes a read useful.
Sources. Pfirrmann CW, Dora C, Schmid MR, Zanetti M, Hodler J, Boos N. MR image-based grading of lumbar nerve root compromise due to disk herniation: reliability study with surgical correlation. Radiology 2004;230(2):583–588. — grade definitions, κ 0.62–0.67 interobserver and 0.72–0.77 intraobserver, and r = 0.86 against surgical grading, all checked against the full text.

Lee S, Lee JW, Yeom JS, et al. A practical MRI grading system for lumbar foraminal stenosis. AJR Am J Roentgenol 2010;194(4):1095–1098. — grade definitions, sagittal T1 as the primary sequence, and κ 0.905–1.0 interobserver / 0.800–1.0 intraobserver, all checked against the full text. The system was developed by consensus between two radiologists, two orthopaedic surgeons and three neurosurgeons, and it replaced the earlier Wildermuth and Kunogi–Hasue schemes, neither of which accounted for direct root compression or deformity.

Figures reproduced from those two papers pending permission. Every image on this page is clickable.